Enhanced Aggregation Options, Advanced Data Processing, and Interactivity in ipyvizzu 0.16
Hey there, data storytellers! Exciting times as we roll out ipyvizzu 0.16, marking yet another stride forward in crafting compelling narratives from your data. Let’s dive into the details that set this version apart.
New aggregation capabilities
Drawing inspiration from our JavaScript library, we’ve integrated a new set of aggregation functions into ipyvizzu. Gone are the days of solely summing your data. Now you have the opportunity to show the minimum, maximum and average of values, count occurrences, or the number of unique data points. Look at the examples below to see how they work in action.
More practical examples
Our latest version introduced a collection of practical examples directly aligned with real-world scenarios and our open-source community has contributed instances involving Excel, Sheets, and SQL-related data conversions, showcasing the versatility of ipyvizzu.
We’ve also perfected our analytical operation examples, which led us to streamline our documentation by retiring the more schematic animated samples. In addition, we’ve built an example to show you how to personalize your chart’s background using any images, just as we’ve done with our logo here:
Advancing data processing
0.16 brings a suite of features that enhance the integration of your analytical prowess.
- We’ve incorporated support for Spark DataFrames and numpy arrays, providing flexibility in handling diverse datasets.
- We expand the versatility of data records. Alongside the existing RecordValues list, we’ve introduced the option to utilize a dictionary format, which opens doors to novel ways of inputting your data.
- We’ve extracted our pandas DataFrame converter into a distinct module, a resource designed not only for your convenience but also to serve as a valuable tool for fellow developers and diverse environments, aligning with our commitment to empower data-driven insights at every turn.
- And we set a
max_rowslimit of 100k for dataframes to prevent potential browser memory issues. If your dataframe surpasses this limit, it will be randomly sampled down. But the default value can be adjusted via themax_rowsparameter of theadd_dffunction.
Explore these options through our dedicated Data chapter in the tutorial.
Further advancements
Introducing new events in ipyvizzu:
- We’ve unveiled new pointer events beyond the existing
mouseon(now namedpointeron). These additions offer heightened flexibility and an intuitive experience when crafting data narratives. - The
draw-beginanddraw-completeevents have also made their debut, allowing seamless synchronization of actions with rendering initiation and completion. - The
plot-area-drawevent also extends customization options, ensuring your story unfolds just how you envisioned it.
Adding new parameters to your arsenal:
- The
stepchannel config parameter empowers you to define custom intervals for interlacing, ticks, and labels on your axes. This control guarantees optimal readability and clarity, accommodating even the most intricate datasets. - Additionally, the
plot.areaColorstyle parameter enables you to change the color of the plot area, like in this example below.
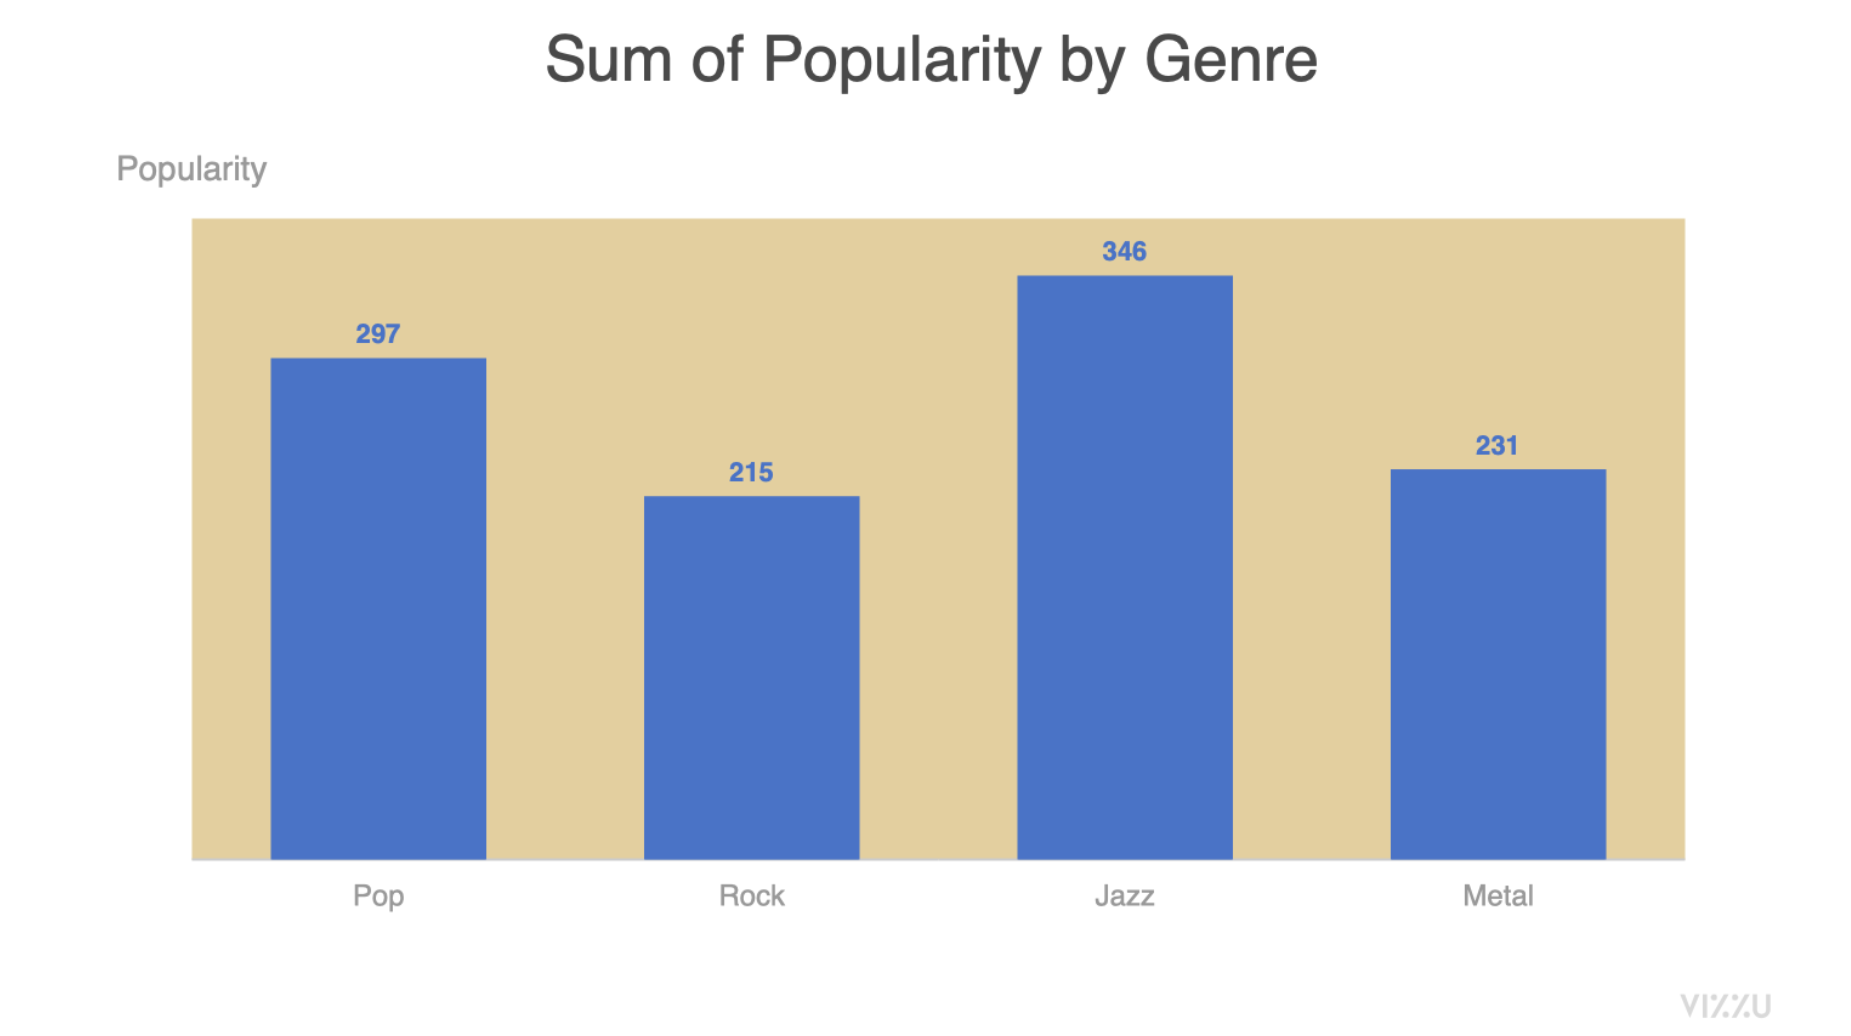
Setting the plot.areaColor style parameter on a Vizzu chart
Introducing usage statistics
In our commitment to progress and user satisfaction, we’ve introduced the Usage Statistics feature within ipyvizzu. This aggregates usage data, contributing to a better understanding of the library’s usage trends and helping us to allocate resources effectively.
Your privacy remains a constant priority – we do not track, collect, or store any personal or identifiable data, and the feature is optional.
By default, it’s enabled, but if data collection isn’t your choice, opting out is hassle-free. And also, note that even while active, this feature ensures full GDPR compatibility for every creation you make with ipyvizzu.
Check out our full release notes here for a complete list of all updates and improvements.
So this is it, another great step moving forward in creating a world-class animated data storytelling tool. We can’t wait to see the explorers and stories you’ll build with ipyvizzu 0.16.
As always, we welcome your feedback and suggestions to continue refining and enhancing our library. Email us at hello@vizzuhq.com or join our Slack for support and input from other community members.
Thank you for choosing ipyvizzu, and happy charting!