New Aggregation Functions, Events, and Parameters Introduced in Vizzu-lib 0.8
Greetings, Vizzu JS-lib users! We are excited to unveil our beloved Javascript library’s newest release, version 0.8. With this update, we addressed numerous minor fixes and introduced new features that enhance flexibility, performance, and the overall user experience.
Advanced aggregation functions
We introduced various aggregation functions besides the previous sole summing. Now, with ‘min()’, ‘max()’, ‘mean()’, ‘sum()’, ‘count()’, and ‘distinct()’ at your disposal, you can easily visualize complex calculations without the need to do them manually. Dig deeper to discover the smallest, largest, or average values, count occurrences, or extract unique data points with ease, as in the examples below:
Enhanced control with new event options
Improve interactivity by adding new ‘pointer’ and ‘draw’ events.
- Previously, we only had the ‘mouseon’ event, which has now been renamed to ‘pointeron’, plus we have released three additional ones - ‘pointermove’, ‘pointerdown’, and ‘pointerup’. We believe these will provide greater flexibility and a more intuitive experience when telling a data story.
- We’ve added the ‘draw-begin’ and ‘draw-complete’ events, allowing you to connect actions directly to the starting and ending points of the rendering. Additionally, the new ‘plot-area-draw’ event provides further customization options.
New config and style parameters
We have two brand new settings released this time:
- The ‘step’ channel config parameter that allows you to set custom intervals for interlacing, ticks, and labels on the axes. This provides precise control over the visual presentation, ensuring optimal readability and clarity in your charts.
- With the ‘plot.areaColor’ style parameter, you can customize the color of the plot area of your charts, as you can see on this example below.
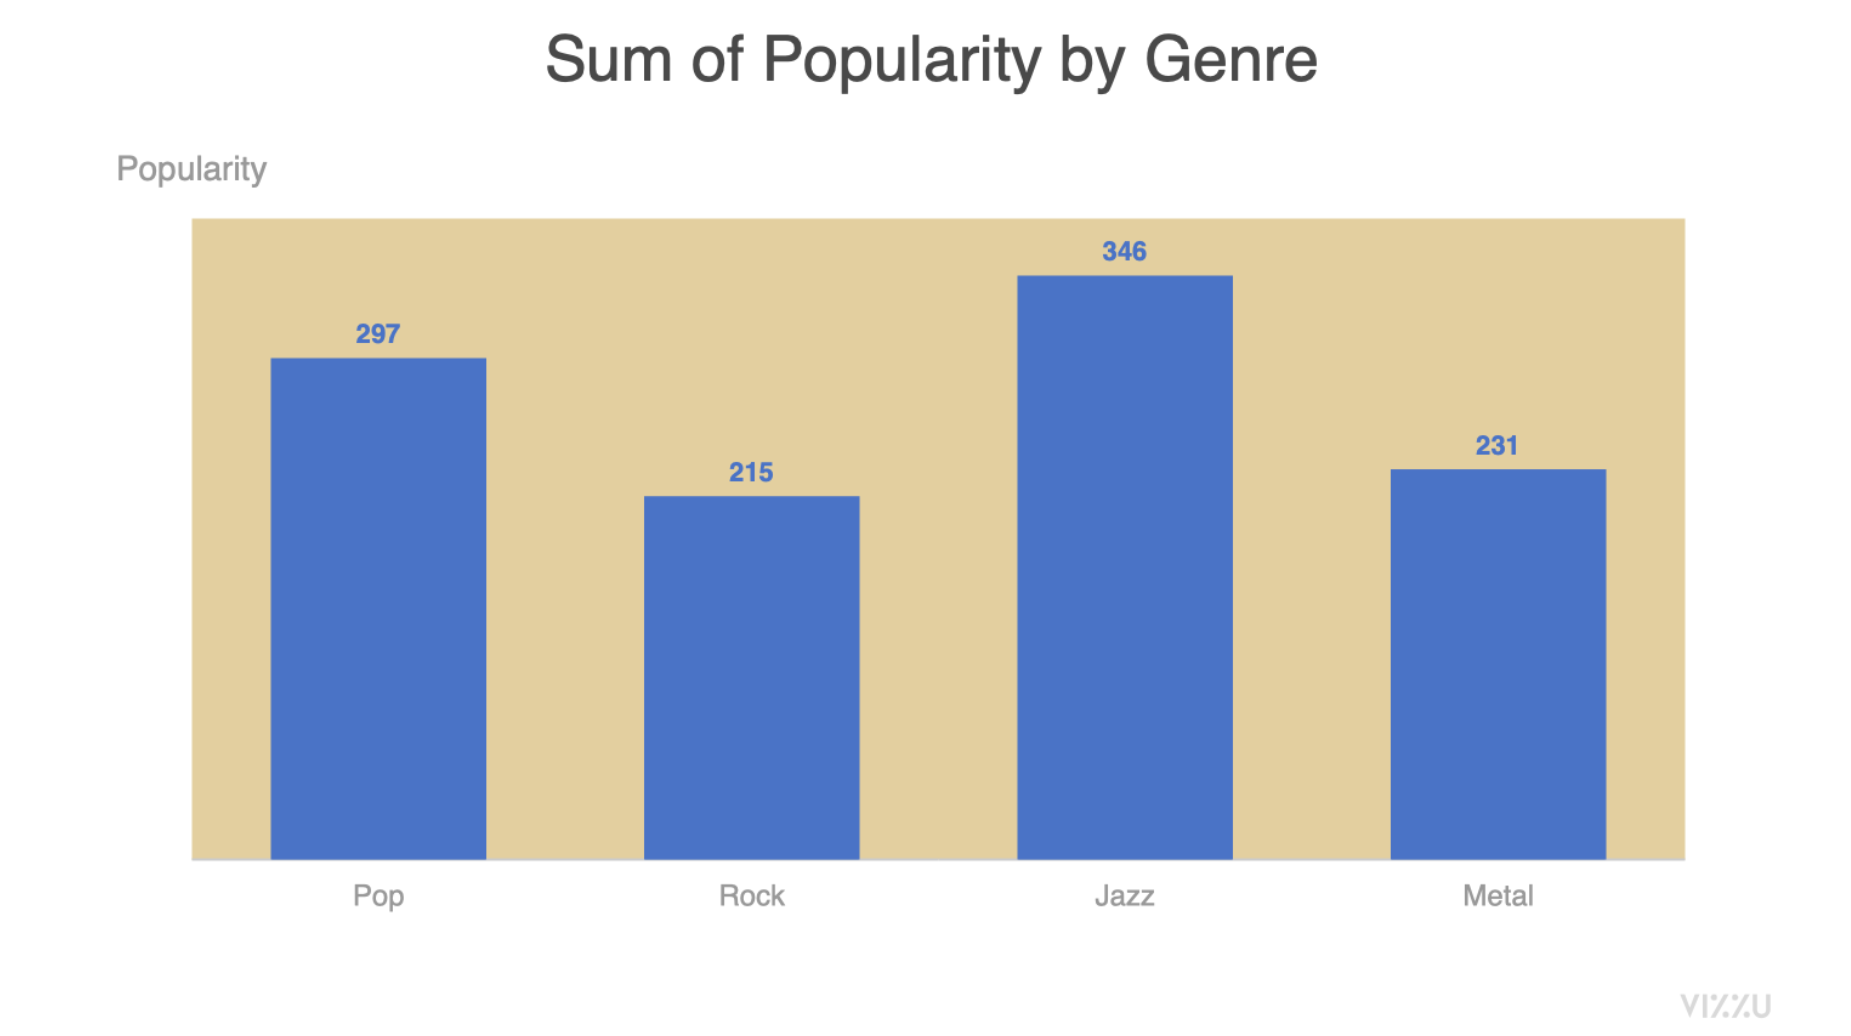
Setting the plot.areaColor style parameter on a Vizzu chart
Further advancements
Apart from the above upgrades, Vizzu-lib 0.8 introduces many additional features that elevate the overall user experience.
- Previously we faced challenges in creating a smooth transition between line and area charts when different data points were connected during the animation. We’ve resolved this issue plus introduced the ‘connection’ animation option group, which allows fine-tuned control over the timing of transitions between area and line charts.
- Data records can now be specified using objects, offering an alternative way to structure data for your visualizations. Check out all the options in our tutorial’s Data chapter.
- Now we support mid-animation marker clicks, enabling users to interact with markers during animation.
- Additionally, with a faster bubble chart algorithm, now even large datasets with numerous markers can be animated seamlessly.
For a complete list of all updates and improvements, check out our full release notes here.
So this is it, another great step moving forward in creating a world-class animated charting library. Can’t wait to see the data stories you’ll build with Vizzu-lib 0.8.
As always, we welcome your feedback and suggestions to continue refining and enhancing our library. Email us at hello@vizzuhq.com or join our Slack for support and input from other community members.
Thank you for choosing Vizzu, and happy charting!